
2020: before and after week 13
The official UK government figures for registered deaths in England and Wales in 2020, week by week

Further to this article…

…which features a report of the First cases of coronavirus confirmed in Britain five years ago to this day, it seemed like a fitting time to put out this rather briefer post featuring more on the weekly official government data for registered deaths in England and Wales in 2020.
For context:
It seems widely agreed that covid was circulating in the UK in January 2020.
On 19th March, the UK government announced that “COVID-19 is no longer considered to be an HCID1 in the UK”
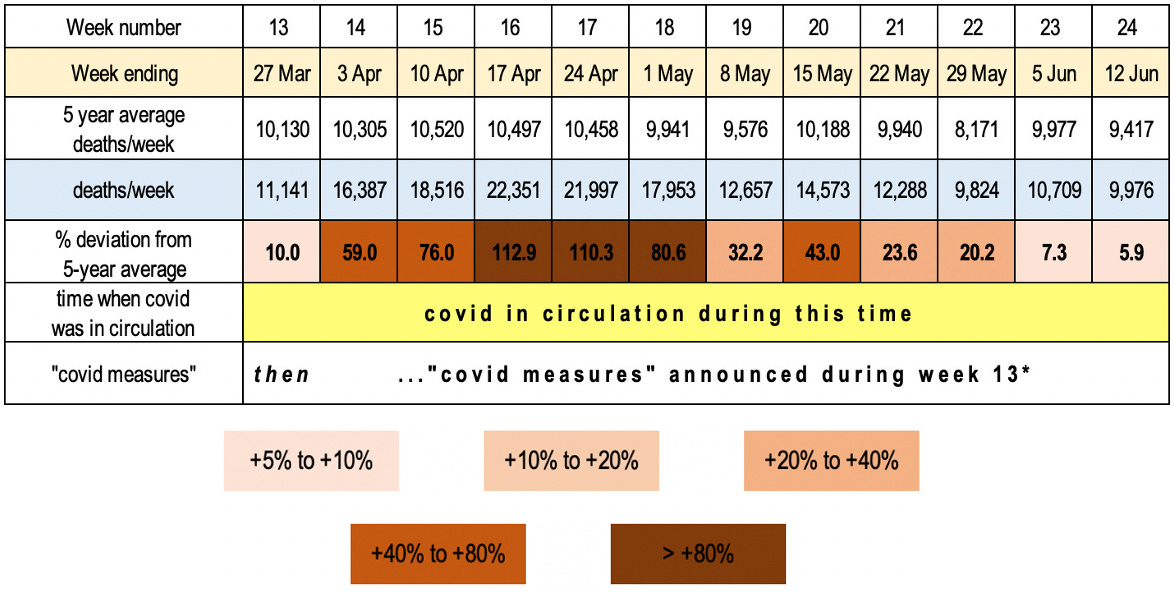
I took the ONS numbers for registered deaths week by week from mid-late January.2 And I calculated the % deviation from the 5-year average. For example, if the average were 10,000, and 10,700 people died, the figure would be +7%. And if 9,700 people died, the % deviation would be -3%.
I coloured the % deviation figures accordingly:

Here is the resulting table:

As you can see, during those two months or so when covid was in circulation, registered death numbers were close to average or below average. This was a time when people were living life normally, in schools and universities, in hospitals, in shops and businesses, in clubs, at sporting events, at cinemas and theatres, in pubs and restaurants, in places of worship etc.
Yet this was the context for then-Prime Minister Boris Johnson’s announcement on 23rd March 2020 that resulted in schools and universities being closed (to most students) and educational activities restricted, going to hospital being strongly discouraged, and “non-essential” shops and businesses being closed. Along with clubs, sports activities, cinemas and theatres, pubs and restaurants, places of worship etc.
This was how the BBC (part of the Trusted News Initiative3) covered the story:

The “covid measures” legally came into force on 26th March 2020.
Here are the figures for the next 12 weeks:
No grey (let alone green) required…
And here is a snapshot of the data in the six weeks before and the six weeks after the introduction of the “covid measures”:

To reiterate, the inconvenient truth is that the death rate increased only after the first lockdown was announced and the “covid response” began. When people panicked. When people were terrified by their governments. When people were told, “Don’t come into hospital if you can help it.”
And when “covid protocols”4 were adopted, including the administration of midazolam and the denial of antibiotics. For those “testing positive for covid” with a fraudulently-conducted test where, in the words5 of its Nobel Prize-winning inventor, “if you do it well, you can find almost anything in anybody”.
Related:


HCID = high-consequence infectious disease
NB the number of people dying is usually substantially higher during what is considered to be peak respiratory virus season (around December to March). According to the ONS, the average number of weekly deaths registered in England and Wales is around 13,000 in January, and around 9,000 in August.
Such as the document NG163, COVID-19 rapid guideline: managing symptoms (including at the end of life) in the community, which is no longer available on the NICE website, but can be viewed e.g. here (archived version) or here(pdf, c/o this related article)
You might have to click twice on that link… and turn off the mute… and/or be logged into X:
